Strategic Surveillance Sensor Modeling & Analysis
For most imaging sensor applications, the objects of interest are much larger than the individual pixels on the focal plane. The types of analysis and modeling make this assumption. However, for space-based surveillance the sensors are at such an extreme range that the objects of interest projected onto the focal plane are much smaller than a single pixel. In this operational regime the sensor is characterized by the Noise Equivalent Flux Density (NEFD) rather than Noise Equivalent Difference in Temperature (NEDT). As shown in Figure 1, the size and shape of the thermal energy projected onto the focal plane from a distant target is a function of the sensor’s Optical Transfer Function (OTF) rather than the size or shape of the target.
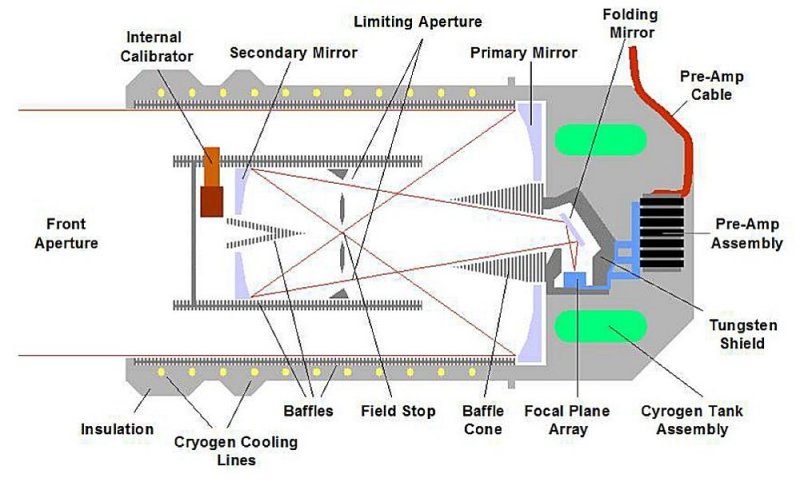
Members of the TBU have experience with this special domain of sensor modeling, particular to space-based LWIR surveillance systems. BRC maintains a library of conceptual design and analysis tools for modeling the performance of such sensors. The diagram of the telescope of a generic space-based surveillance system shown in Figure 2 shows some of the inner structure and baffle that affects the optical transfer function (OTF). The OTF in turn can be mapped to the specific blurspot shape projected onto the focal plane due to a point source target. Knowledge of the shape of the blurspot can be exploited to achieve better resolution performance than would be expected based on first-principles analysis of the diffraction-limit.
For point-source sensors, the measure of the ability to detect a target is the Noise Equivalent Flux Density (NEFD). Given a target intensity (in a selected passband) J(λ), the transmission through of the optical path in the same passband T(λ) and the range R to the target, we can calculate the required NEFD,
NEFD = J(λ) x T(λ)/(SNR x R2)
with a signal to noise ratio of SNR.
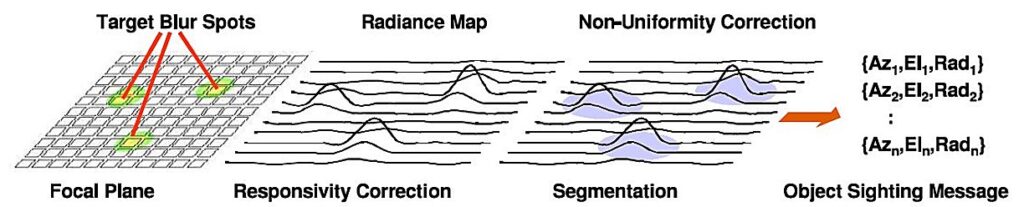
A summary of our sensor modeling library are shown in Figure 14, including an application that convolves the sensor OTF with the target point source (or other target shape), a tool to simulate 1/f and other sources of sensor electronics noise, the application of external background clutter, and a tool to match the composite radiance map to the resolution and detector layout of the focal plane array. The output of the focal plane array can be converted into a target list of object sighting messages. When two or more point-sources are very near one another their blurspots can overlap producing Closely Spaced Objects (CSOs).
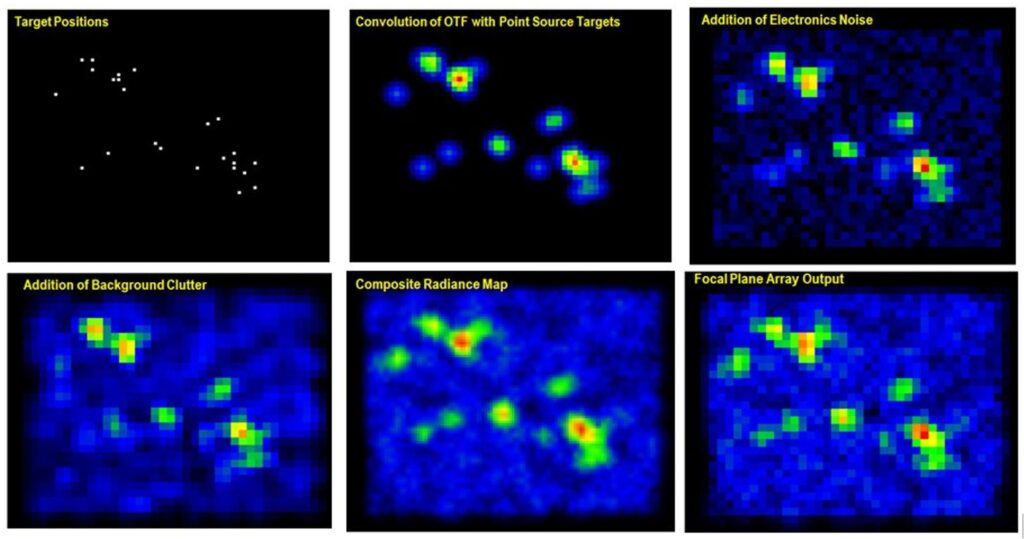
The geometric positions of the sensor and the targets determines the arrangement of targets on the focal plane. Next the blurspots are determined based on the target ranges, intensities convolved with the OTF of the sensor telescope. The sensor electronic noise can be added at this step along with the background clutter to produce the composite radiance map on the focal plane. Finally the size, shape and arrangement of the detectors on the focal plane determine the perceived image. The Focal Plane Array Output can be passed to the signal and data processing operations to model systems level performance. Key performance parameters extracted from these modeling tools include CSO Resolution, Track Initiation and Track Continuation, Classification, State Vector Accuracy, Handover and Lethality.